

Data-Driven Construction
Why, What, and How

TL;DR There is real value in construction to make better use of the mountains of data we generate to make better decisions, faster. To take advantage we need to ensure that the data strategy is aligned to the business strategy - and stand-up a data architecture and team to accomplish it. Start small - prove the ROI - then scale.

Before we get into this, let’s start by saying I’m not an expert in this subject.
Then why write this? Though I’m not an expert I can see a clear need to do better. I also write to understand - basically, I choose a subject I care about or would like to learn more about and then set about learning until I feel comfortable enough to write about it.
That said - if you have views on the subject or the detail in this article then please do reach out, I’d love to learn more.
I’m just interested in doing things better in construction - less waste, more value, and fixing the issues (or the opportunities) currently facing construction.

Why Data-Driven?
In construction we create amazing amounts of data. Think about all the processes that are used to get the most basic project from start to completion:
Tender/bidding processes
Feasibility, Optioneering, and Design Development
Technical design
Preconstruction
Construction
Handover and Commissioning
We have come a long way from when I joined the industry in 2007. Most of the processes above, inside most organisations, have been partially or completely digitised. That is to say we’ve taken old paper based analogue processes and records and pulled them into the digital realm or similar.
For example, in contracting - our quality checklist are now completed on phones or tablets within apps, rather than in paper form.
This has created a huge volume of accessible data from our existing processes. The next stage of development is to take data available to us, from traditional and contemporary processes, and using it in a more intelligent way to make our processes less wasteful, less resource hungry, and more automated - generating value from data
Data → Information → Knowledge → Wisdom.

Better decisions, faster

Armed with greater amounts of data, processed and communicated effectively the leaders of our construction industry, companies, and projects can ultimately make better decisions, faster. They will have the right information, at the right time, to make the right decision - which will help achieve better outcomes at all levels of construction.
For example; seeing and understanding the ripple effects of change quickly, ongoing indications of key performance metrics, or recognising patterns to see potential risks in projects.
The changing industry - demand, growth, complexity

In the near future construction has a big challenge with both a higher demand in the volume of work to be done, and a shrinking workforce with which to achieve it. In the USA alone there is a $550 billion spend coming down the pipeline for infrastructure development.

This is in a country and industry where in October 2021 402,000 construction positions remained unfilled, the second-highest level recorded since data collection began in December 2000 (Bridging the labor mismatch in US construction, McKinsey). The industry is stretched and stretching.
Added to this we have more and more governance, processes, and data on our projects which all needs resource to deal with.
Developing our capability and capacity to utilise data to drive toward our desired outcomes can make our processes much leaner, therefore requiring less resources to meet our needs.
Get It Right ✅
Our industry has another, compounding, issue. We have a phenomenal amount of waste. The two figures from the UK’s Get It Right Initiative (GIRI) below illustrate this incredibly well:

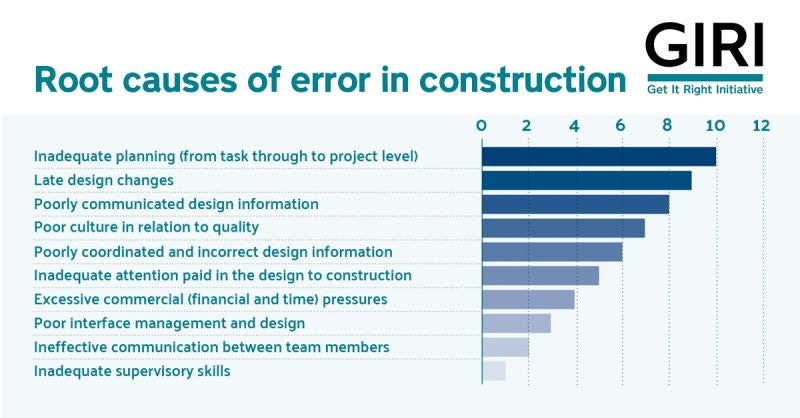
The above amounts to an estimated 10-25% of project costs, or £10-25 billion per annum across the sector in the UK alone. We have to do something to stem this flow.
Data isn’t the only answer but it is part of it. Looking at the categories in the root causes diagram a data-driven approach can support better:
Planning
Management of change
Communication
What is Data in Construction? 🤷♀️
So, what is data in construction? As established in the why above construction has many processes, most of which are becoming more digitised, with thousands of pieces of data associated with them - from design, to planning, commercial and procurement, to performance, survey, and asset information. You name it - there is inherent data associated with it - and this is GROWING 🪴.
Types of data
Whatever the content of the data, it will fit into one of the below six types:
Master Data - core data in the enterprise with describes objects around which business is conducted. From Wikipedia: "data about the business entities that provide context for business transactions". Examples; parties, roles
Unstructured Data - tends not to have a predefined structure or organisation and tends not to have a predefined data model. Examples; email, white papers, articles, specifications, marketing or comms. material, video and voice recordings
Transactional Data - relates to business events of historical significance or needed for analysis by other systems. They have a time dimension, a numerical value, and refer to one or multiple objects. Examples; sales, deliveries, invoices, claims
Metadata - data about other data. Examples; XML docs, report definitions, column descriptions, log files, config. files
Hierarchical Data - sets of data which are related to each other based on hierarchical relationships. Sometimes considered a 'super master data management domain' as it can be critical to understanding the relationships between master data. Examples; organisational structures
Reference Data - Master Data used to categorise other data or used to relate data to information outside the enterprise. Often static or slow changing. Examples; currencies, countries, time
It’s important to understand these different types of data and their use so that they can be managed accordingly within the business.
What is also useful to understand are the characteristics of data. These can be remembered using ‘the 6 V’s of Data’:
Volume - amount of data
Variety - what different types
Velocity - speed of generation and collation
Value - how to gauge the value to your outcomes and decisions
Veracity - what is and isn't reliable
Variability - how fast data changes over time
Use of data
Before deciding what data we want to capture and make use of we must review our business goals and establish how data collection and analysis can support them.
A common use of data capture is to create measurements which can indicate our execution in a given domain, and possibly combine multiple indicators to give a general understanding of performance.
These can be ‘leading’ or ‘lagging’ indicators:
Leading indicators predict the future conditions or performance based on historical patterns. These can only be as accurate as the understanding of the pattern but allow future prediction.
Lagging indicators measure the current or, more likely, slightly past conditions or performance. These are a true representation but can only be in the past.
In practice the best route to take is a healthy mix of both which each complementing each other - with feedback loops formed to tighten understanding.
How to build a data-driven construction company?
Align 🔗
The most important part of building a data-driven enterprise is to ensure that the strategy and architecture to collect, process, and analyse data is in true alignment to help accomplish the outcomes the business desires.
If the business plan and data strategy are in alignment - and then architecture is built to achieve the strategy - it clears the path to use the data effectively, leveraging reporting, business intelligence, advanced analytics, artificial intelligence, machine learning, and the like.
Scale 📈
In order to bake in data-driven at scale Data Governance is key. These are the standards and policies around data - helping grow fast with consistency. Good data governance will:
Align business and data activities
Standardise systems, policies, and procedures
Reduce operational friction
Promote transparency, monitoring, and tracking
Reduce cost and risk
Simplify the process
Increase data literacy
Who? 🕴️
If an organisation is committed to becoming data-driven then they will need to ensure that data is represented at the highest level of decision making and authority.
The position is known as a Chief Data Officer (CDO), and to be successful they should have:
a mandate for change
accountability of data
a clear position to lead - they should be supported by the CEO or the board.
To be effective these professionals need to be empathetic and a good communicator, and highly collaborative.
They will be accountable for establishing the Data Strategy and establishing the resources and processes to achieve it.
This includes driving up data literacy across the organisation - helping people understand what's available to them, give them the skills to deal with it, and allow them to leverage the data.
Data Strategy 📃
The overarching driving force behind effective use of data is the Data Strategy. This will consist of:
The Business Strategy
how experience and outcomes improved by the sythesis of data - information → knowledge → wisdom.
Enhanced customer experience
New products or services
Improve employee experiences
Implement operational capabilities
Data Application
the way an organisation harnesses data helping to turn information into knowledge and finally wisdom.
the Data Strategy should define:
formats, tools, and interfaces;
reporting and descriptive analytics;
diagnostic, predictive, prescriptive, and cognitive analytics.
Data Management
fosters preparation of high quality, scalable, secure, and trusted data
defines the approach to data strategy with regards;
People
Process
Technology
Systems
Performance.
The Operating Model
The operating model defines:
Data Architecture and Platforms;
Data Governance;
Data Operations;
Data Privacy;
Data Security
Data Analysis
Once the strategy and resources (team, processes, hardware, software) are in place then we can then start reaping the value from the hard work. To do that we start analysing our data to help us make decisions. Below are the types of analysis available to us:
Descriptive reporting and analytics answers the question - what happened? For example transactional, financial, operational and historical reporting.
Diagnostic analytics answers the question why did this happen? And what can we learn from it? For example performance evaluation, monitoring and alerts, self-service analytics and statistical analytics.
Predictive analytics answers the question what's most likely to happen? This includes a rules-based engine and the ability to schedule outcomes, improving forecasting and the development of dashboards. Like when Netflix recommends a show to you based on what you've previously watched.
Prescriptive analytics answers the question what should we do? Optimised outcomes, enhanced decision support, real-time analysis and machine learning are all examples.
Cognitive analytics approximates some facets of human level intelligence and is used for common analytics tasks. This brings together analytics and practical decision-making. Some combination of decision automation, natural language processing, neural networks, artificial intelligence, signal processing and robotics are examples of cognitive analytics
Each of these is a step up from the previous - building in both value and complexity. Each analysis type is not needed for each use case you have - practically, the most cost effective method to achieve the desired outcome should be taken - also taking into account capacities and capacity in your team(s).
Putting it all together 🌐
In general, what we’re trying to do with this is make better decisions, faster - so that we can reduce error, beat competition, and reduce resource need 💰.
We start with the business strategy - defining our targeted outcomes. If we’re working for profit then we’ll probably be driving for revenue growth. The metrics for this will be how much and when - therefore data application defines how you will apply data to address the outcome. The will encompass a comprehensive data strategy with building blocks to build the processes to enable better outcomes.
Data architecture defines the standards used to to collect, store, manipulate and disseminate data. Platforms (software, i.e. BIM360, ASite, PowerBI, Office365, etc…) need to be carefully selected to form an integrated set of tools to meet your end-to-end data needs. All combining to deliver the data to people who need it when they need it - ensuring the data has been organised to make higher-quality decisions.
Data governance, when done effectively, ensures consistency and trustworthiness of data. It's important to develop data governance awareness in the team, optimally even beyond those whose primary responsibilities are in the data realm.
And finally, not to forget (please!), Data Privacy and Data Security:
Data privacy is used to keep confidential data, confidential. For example, personal data, financial data, and data related to intellectual property.
Data security focusses on unauthorised access, theft or corruption of data. This should take into consideration threat from inside the organisation, outside, and from human error.
Final Thoughts 💭
This is a complex subject - and clearly one article will not arm you to fully undertake data-driven transformation. As stated above - I’m not an expert, the above is the culmination of reading, Youtube(!), training, and discussion. There are many experts out there who can support your company on this journey.
However, I will say this - start small, on specific use cases that will be of high value to you. This will provide an opportunity to learn and then scale based on experience with proven return on investment.
I hope this has been as interesting to read as it was to research and write. As usual - if I’ve messed up somewhere, a point is unclear, or you would like to discuss the content please do reach out. I’m here to learn.
Thanks to David Milnes for the feedback!